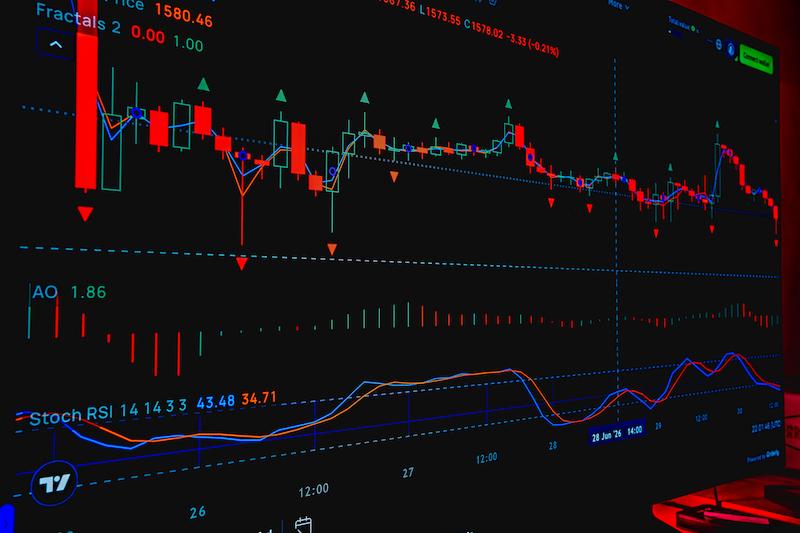
Chart reading is not magic, but it provides a structured way to think about prices. When traders open a platform to follow Sensex Today Live, many of them immediately look for support and resistance zones to decide where to act. Some also compare patterns with the DAX chart to see whether similar formations appear elsewhere, which helps them judge how reliable a particular signal might be. Used wisely, technical levels give shape to what would otherwise feel like random movement.
Table of Contents
Support and Resistance Basics
Support is a price level on the chart where buyers have emerged in the past on the decline, and the selling pressure has been neutralised. Resistance is the price level where the market has been closed several times on the advance. Trend lines are drawn on critical levels where many market participants feel some pressure or comfort. They are significant because whenever such a level is overcome with strength, its role is reversed. To begin drawing, one should mark all the key levels on their chart.
Moving Averages as Trend Filters
The two most common moving averages, fifty-day and two-hundred-day, act as a trend filter for the Indian stock market benchmarks. Prices are considered to be in a good trend if they are above the crucial moving averages, and a reversal is likely to happen if the prices are below the fifty-day moving average. The crossing of the two moving averages on the price chart in an upward direction is also viewed as a positive sign. It is essential to understand that none of the moving averages can predict the future, whereas they only help to identify the trend.
Volume Confirms the Moves
A price move on heavy volume has more significance than a price move on light volume. A breakout above resistance with a substantial increase in volume confirms the breakout, whereas a price increase on light volume needs to be taken with a grain of salt. One should always evaluate the volume along with the price level. Such a simple step helps to separate noise from meaningful moves.
Momentum Indicators and Their Limitations
Various momentum indicators help to measure the speed and strength of the trend. The Wilder indicator, for example, measures overbought and oversold conditions, and the value above seventy suggests that the price is in an overbought region while the value below thirty points to an oversold condition. Trending markets often maintain overbought conditions for an extended period without correcting. Thus, such price levels cannot be used as a reliable filter. Momentum indicators also help to identify divergences, which occur when the price chart reflects different behaviour than momentum indicators. However, one should only consider these divergences as warning signs and not exit the trade immediately.
Turning Levels into a Plan for a Trading Session
The basic session planning begins with identifying the closest support and resistance levels for both the benchmark and stock. One should think about what will make them buy and when they will refrain from trading. It is essential to set the stop-loss at the level that will not allow the trade to move in the opposite direction. Setting the target is also crucial, as it should be set at the next significant level where the trade makes sense. The reward-risk ratio should be at least 1:2. If the setup is not working, the patience of the trader is likely to be rewarded.
Respecting the Limits of Technical Analysis
Price levels and trends only reflect what has already occurred, whereas breaking any level on the chart can be caused by multiple factors, including political and economic news. As much as technical levels help to predict future moves, they should not be used without fundamental analysis and money management rules. A trader should not rely only on technical analysis, as it is confusing and counterintuitive by nature and using multiple indicators only makes it worse. The chart should be clean and transparent to be able to focus on a few essential levels.
Conclusion
Technical levels can help to trade with more confidence as they add discipline and structure to the trading process. Various tools help to determine the crucial levels where the price is likely to change its direction. All level types, including support and resistance levels, moving averages, volume, and momentum levels, should be used together with proper money management and realistic expectations to make the technical analysis more precise.